
Beyond the Outage: Measuring Recovery Time from Electromagnetic Disruption in Critical Infrastructure
Introduction: Hidden Vulnerability in a Reliant World
Modern society depends on digital and cyber-physical systems for everything from energy and communications to navigation and industrial control. These systems are engineered for robustness and uptime, but they often do not have built-in tools to assess how long it takes to recover when things go wrong—especially when the event is caused by electromagnetic disturbances rather than conventional faults.
In short: We tend to plan for failures, but we rarely quantify recuperation. That gap is the core problem this article explores.
Electromagnetic Threats: Two Sides of the Same Coin
The class of threats relevant here can be grouped broadly into two:
- Natural (space weather / geomagnetic disturbances)
Solar flares and coronal mass ejections (CMEs) interact with the Earth’s magnetosphere and can induce large, time-varying magnetic fields on the ground. These, in turn, can force geomagnetically induced currents (GICs) in long conductors (e.g. power lines, pipelines, grounding networks). Components interfaced to these conductors—transformers, control electronics, sensors—can see voltage transients, saturation, timing drift, or damage (Natural Resources Canada, 2025).
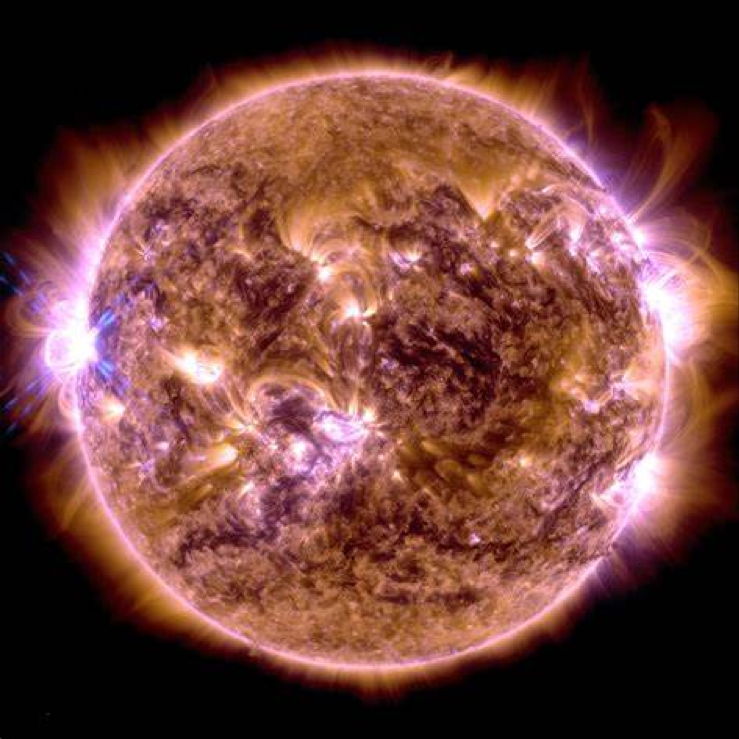
Figure 1: X8.7 solar flare observed May 14, 2024, by NASA’s Solar Dynamics Observatory (SDO); the brightest region at lower right is the eruptive site (NASA/SDO). Associated ejection missed Earth, limiting effects.
- Man-made electromagnetic weapons or HPEM / EMP
High-power electromagnetic (HPEM) or electromagnetic pulse (EMP) weapons intentionally inject strong fields or pulses that can upset electronics over broad areas. In defense programs, these threats have been studied for decades. The same physical coupling paths (signal lines, power buses, sensor wiring) that adversaries exploit are also present in civilian systems (EPRI, 2019).
Despite their different origins, both natural and man-made EM disturbances can simultaneously affect multiple hardware/firmware/software components—making them more pernicious than simple component-level faults.
History Speaks: Real Events That Expose the Risk
a. March 1989 Geomagnetic Storm
A severe solar storm triggered a nine-hour blackout in Quebec, Canada when the Hydro-Québec transmission grid collapsed under GIC stress (Natural Resources Canada, 2025). That event is often cited as the canonical warning for space-weather risk to modern power systems.
b. 1921 “New York Railroad Storm” (May 1921)
This incredibly intense geomagnetic storm caused telegraph systems to spark, fires in relay circuits, and even arcing in equipment (USGS, 2019). If such an event happened today, the interdependencies of modern electronics, control systems, and communications would amplify the consequences.
c. The “Near Miss” of July 2012
A massive coronal mass ejection narrowly missed Earth in 2012. Many analysts believe it could have delivered effects comparable to the Carrington Event (1859) if it had been Earth-directed (NASA, 2014). Some estimates placed the hypothetical cost of such a storm to the U.S. infrastructure in the hundreds of billions to trillions and multi-year recovery timelines.
Together, these examples show that electromagnetic disruption is not purely theoretical; historical precedent and near-miss events highlight real risks faced by modern infrastructure. Their recovery timelines determine whether an outage remains manageable or becomes a prolonged catastrophe.
The Missing Metric: Recovery Time Under Disturbance
Most resilience or reliability models focus on “did the system come back?” or “how often do faults occur?” But these don’t tell us the whole story. In many critical domains, the time between disruption and restoration to useful baseline function (let’s call this recuperation time) is more consequential than the outage itself.
Why? Because the damage from delayed recovery can cascade—failures in backup systems, human error under stress, synchronization drift, incomplete reconfiguration, or operator “staging” delays.
A true resilience metric should capture not just failure but how fast and by what path a system returns to function. The resilience-curve or “trapezoid model” is a useful visual metaphor: performance drops at the disturbance, then recovers gradually (or in steps) rather than instantaneously. The integral under the drop curve is a measure of “lost capacity” over time. See the resilience-curve visual below in Figure 2.
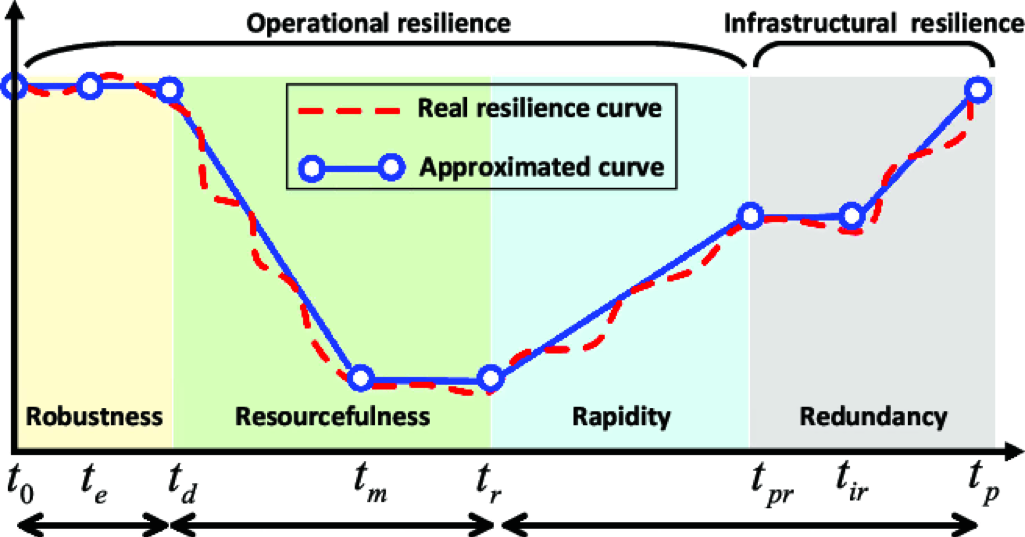
Figure 2: Conceptual resilience trapezoid associated with event on energy distribution system (Gazijahani et al., 2022).
Even hardened or redundant systems can perform poorly in recovery unless the restoration path is well understood and optimized.
A Cross-Sector Challenge: Many Domains, One Problem
The recovery-time problem is not unique to the power grid. Below are sectors where this challenge is material:
| Sector | Why EM Disturbance Matters | Why Recovery Time Matters |
| Electric Power / Grid Infrastructure | Substations, control systems (SCADA, relays, RTUs) are susceptible to GICs and HPEM transient coupling | Restoration of control paths, synchronization of nodes, step-up transformer reconfiguration — delays can cascade |
| Telecommunications & Infrastructure | Base stations, microwave links, fiber network electronics, timing nodes | Loss of synchronization, forced resets, signal dropouts — downtime degrades services regionally |
| Industrial Control / Manufacturing | PLCs, sensors, automation loops, feedback control | Disruption in closed-loop control; resumption of “safe” states, restart sequencing, error correction |
| Navigation / Timing Systems (GPS-dependent infrastructure) | GPS receivers, timing clocks, synchronizers | Disturbance in clock stability or synchronization drift; re-synchronization and verifying integrity |
| Emergency / Public Safety Systems | Dispatch centers, communication nodes, control consoles | Loss of communications or control in crisis elevates risk; fast recovery is essential |
| Data Centers / Cloud Infrastructure | Server electronics, networking gear, timing distribution | Bit flips, control-plane errors, synchronization glitches — recovery path tuning matters |
| Medical / Healthcare Systems | Monitoring, embedded controllers, life-critical equipment | Prolonged downtime equals patient risk; restoration paths must be safe, verified |
In each domain, the network, hardware, timing, and human operators are tightly intertwined. Even if automatic recovery logic exists, real-world systems often require operator intervention, diagnostics, device resequencing, or partial rollback—all of which add latency.
Because electromagnetic events may simultaneously stress multiple subsystems and human operator intervention is inherently variable, the true recovery path and subsequent time to recovery is not obvious—and needs modeling, experimentation, and validation. There are several modeling and simulation tools or programs that tackle parts of the electromagnetic problem (eg. PowerWorld Simulator GIC, Siemens PSS E GIC Module, GE Vernova Power Flow, NERC TPL-007-4 Standard, etc.), but generally they either simulate physics or are meant to help manage/drive policy. Nearly all current modeling and simulation tools stop short of simulating system-level recovery dynamics or human-in-the-loop restoration timing while none of the examples listed address both (PowerWorld Corporation, n.d.) (Siemens Energy, n.d.) (GE Vernova, n.d.) (NERC, 2023).
Policy & Programs: Where Current Efforts Fall Short
Governments and utilities are waking up to the resilience challenge, especially for the electric grid. But many current programs are reactive, infrastructure-focused, or limited to physical upgrades, rather than system-level recovery modeling.
DOE’s GRIP Program
The Grid Resilience and Innovation Partnerships (GRIP) is a $10.5 billion DOE initiative (FY 22–26) to bolster grid flexibility, reliability, and resilience against extreme weather and other stresses. Through its funding mechanisms—Grid Resilience Utility & Industry Grants, Smart Grid Grants, and Grid Innovation Program—GRIP encourages modernization, microgrid deployment, advanced sensors, and resilience schemes (DOE Grid Deployment Office, 2024).
To date, multiple rounds of GRIP have funded hundreds of projects nationwide. But while these efforts strengthen infrastructure, few address the “restoration dynamics” problem—i.e. knowing how long systems recover under electromagnetic stress or how operators and systems interplay during recovery.
In other words: GRIP is necessary and useful—but not sufficient for closing the loop on resilience modeling.
Gaps & Limitations
- Infrastructure upgrades focus on hardening, redundancy, smart sensors—but not on system-wide recovery modeling.
- Projects seldom include detailed simulation of complex dependencies (hardware, firmware, communication, operator).
- Funding and standards tend to assume failures are rare and recovery is instantaneous or controlled, rather than deliberate, staged, and possibly delayed.
- Many resilience metrics are retrospective (post-mortem) and do not support forward modeling of new architectures under EM stress.
Thus, a tool that can fill that modeling gap (by simulating EM exposure and measuring recovery timing behavior) positions itself as a complementary technology to these investment programs.
Introducing TAEMDR
At Vigilant Cyber Systems, we are developing TAEMDR (Toolkit for Assessing Electromagnetic Disruption Recovery) as one tool to help fill this gap. TAEMDR enables engineers to:
- Model systems (hardware, firmware, software, interconnects)
- Inject simulated electromagnetic effects
- Monitor human-in-the-loop simulations
- Develop models for system recuperation time
- Estimate time-to-basic-functionality and time-to-full-functionality
Conclusion & Forward Look
The lessons are clear:
- Electromagnetic disruptions—whether from solar storms or HPEM/EMP threats—pose credible and serious risks to modern infrastructure.
- Historical events and near misses illustrate the potential for cascading failure when recovery is delayed or mishandled.
- In nearly every critical domain (power, communications, control systems, timing), recovery time matters more than mere failure detection.
- Existing programs (e.g. DOE GRIP) advance infrastructure resilience, but generally don’t address restoration dynamics and recovery time.
- The need is ripe for analytical tools that can simulate electromagnetic stress and measure the time-path to recovery.
In the next article of this series, we’ll dive deeper into Vigilant Cyber System’s Toolkit for Assessing Electromagnetic Disruption Recovery (TAEMDR) and how it helps fill the gap for needed recovery-aware resilience tools.
References
DOE Grid Deployment Office. (2024). Grid Resilience and Innovation Partnerships (GRIP) Program. U.S. Department of Energy. https://www.energy.gov/gdo/grid-resilience-and-innovation-partnerships-grip-program
EPRI. (2019). EMP and Grid Security: Key Messages. Electric Power Research Institute. https://www.eei.org/-/media/Project/EEI/Documents/Issues-and-Policy/EPRI-EMP-Report—Grid-Security—Key-Messages.pdf
GE Vernova. (n.d.). Power Flow. https://www.gevernova.com/consulting/planos/steady-state-power-flow
NASA. (2014, July 23). Near Miss: The Solar Superstorm of July 2012. NASA Science. https://science.nasa.gov/science-research/planetary-science/23jul_superstorm
Natural Resources Canada. (2025). Learning about space weather. Government of Canada. https://www.spaceweather.gc.ca/info-gen/index-en.php
NERC. (2023). Reliability Standard TPL-007-4: Transmission System Planned Performance for Geomagnetic Disturbance Events.North American Electric Reliability Corporation. https://www.nerc.com/pa/Stand/Reliability%20Standards/TPL-007-4.pdf
USGS. (2019). Intensity and impact of the New York Railroad superstorm of May 1921. Space Weather. https://pubs.usgs.gov/publication/70204992
PowerWorld Corporation. (n.d.). Geomagnetically Induced Current (GIC) Analysis Add-On.https://www.powerworld.com/products/simulator/overview
Samadi Gazijahani, Farhad & Salehi, Javad & Shafie-khah, Miadreza. (2022). Benefiting from Energy-Hub Flexibilities to Reinforce Distribution System Resilience: A Pre- and Post-Disaster Management Model. IEEE Systems Journal. 1-10. 10.1109/JSYST.2022.3147075.
Siemens Energy. (n.d.). PSS®E Version 34.9.6. https://xcelerator.siemens.com/global/en/all-offerings/products/p/psse-version-34.html